

Quarterly Review: Stocks Pull Back from Highs as Markets Are Tested
Dimensional Fund Advisors
After a calm start to the year, stocks took a downward turn late in the first quarter as investors around the world weighed the impact of geopolitical events, notably the war in Iran. In the US, the S&P 500 was down for 2026 as of March 20 after hitting record levels earlier in the year.1 Equity returns in developed international and emerging markets were better than in the US, despite the instability in the Middle East. In the bond market, US Treasuries were lower, with the benchmark 10-year yield rising to nearly 4.4%.2
Through March 20, the S&P 500 Index fell 4.7% and the tech-heavy Nasdaq lost 6.7%. Technology companies pulled back from recent highs amid ongoing concerns about the impact of AI on certain industries, with software stocks in particular declining.3 Trade developments also remained in focus as the US Supreme Court said certain tariffs imposed by the administration using emergency powers weren’t legal.4 Market reaction to that ruling was largely muted, perhaps reflecting expectations already priced in about which way the court would rule.
Market volatility rose and oil prices spiked after the US and Israel struck Iran in late February, with hostilities continuing in Iran and elsewhere in the Mideast into March. The impact on crude supplies helped push oil prices notably higher.5 Amid growing concerns about energy, it is worth remembering that global equity returns have not been correlated with the level of oil prices (see Exhibit 1). While the cost of oil may have some impact on markets, it is just one of many factors that investors consider when looking at market performance.
exhibit 1
Stocks and Barrels
Annual returns for MSCI World Index (net div.) vs. end-of-year crude oil spot prices, 1970–2025
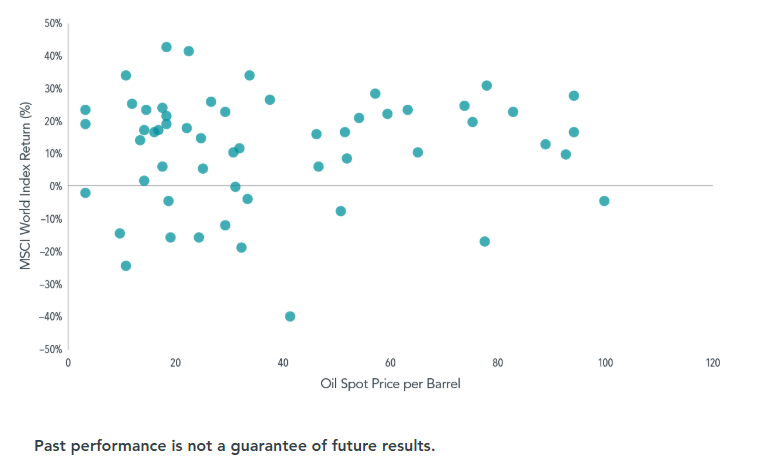
Sources: Dimensional, Federal Reserve Bank of St. Louis. Spot crude oil prices are West Texas Intermediate (WTI). In USD. Indices are not available for direct investment; therefore, their performance does not reflect the expenses associated with the management of an actual portfolio. MSCI data © MSCI 2026, all rights reserved.
Global equities, as measured by the MSCI All Country World Index (net dividends), fell 3.1% as of March 20. Stocks in developed international markets outside the US fared better, losing just 1.5%, as measured by the MSCI World ex USA Index (net dividends). The MSCI Emerging Markets Index (net dividends) fared even better, gaining 4.5%.6 Global equity markets remain near long-term highs, even in the face of geopolitical challenges; over the past few years, stock markets have had positive returns despite numerous conflicts around the world.
Along with the fear and hardship always associated with armed conflict, there can be concern for investors over potential impact on investment performance. But it’s important for investors to be cautious about making asset-allocation changes in response to such events. Markets are forward-looking, and prices move in response to changes in information. When unexpected developments arise that investors deem to be poor for markets, markets often drop. But the flip side is markets always set prices for positive expected returns. Once the news gets reflected in market prices, investors can still expect positive returns even amid worrisome circumstances.
Job Jitters vs. Inflation Fears
The US Federal Reserve held the federal-funds rate steady in a range between 3.5% and 3.75% at meetings in January and March.7 Fed members continued to disagree over which posed the bigger threat—persistent inflation that might argue for higher rates, or a sluggish labor market that may call for lower ones. In February, the US core consumer price index, which excludes more-volatile food and energy items, rose 2.5% from a year ago, slightly above the Fed’s target rate of 2%.8
During the first quarter through March 20, US Treasuries were 0.6% lower, sending the yield on the benchmark 10-year Treasury up to 4.39%.9 The broader bond market also declined, with the Bloomberg US Aggregate Bond Index down 0.7% and the Bloomberg Global Aggregate Bond Index (hedged to USD), a broad benchmark of sovereign and corporate debt, falling 0.5% as of March 20.10
High Marks for Small and Value
Value stocks, or those with low relative prices, and small caps had a strong start to the year in the US, a shift from their underperformance in 2025. Large cap stocks with growth characteristics, or higher relative prices, were particular laggards in the US and globally.11 Relative returns for US small caps broadly, small value stocks, and large value stocks all flipped from negative to positive over 12 months when the end date moved from December to February, despite 10 of the 12 months being identical in both samples.12 This is why trying to time markets is so perilous: Missing these kinds of outsize periods for the premiums can put a dent in your performance. In March, as global events rattled markets, value and small caps took a hit, reinforcing the notion that premiums can be volatile. Elsewhere, high profitability stocks were outpaced by low profitability stocks in global developed markets, while the opposite was true in emerging markets.13
In the first quarter, the US stock market remained concentrated, from a historical perspective, in a small group of mega cap companies, as reflected by their considerable weight in the S&P 500.14 Emphasizing small and value stocks is one way to offset the trend of big companies having an outsize influence on overall returns. Taking a global approach can also help mitigate concentration concerns, since the largest stocks represent a smaller share of markets outside the US.
Since small caps are a meaningful part of the global market, they can be an integral part of a diversified portfolio. These are companies from a variety of sectors, and many have the potential for significant returns. After all, some of the largest and most successful companies of today were small caps once upon a time. A broadly diversified allocation to the small cap market can help long-term investors capture future winners from today’s smaller firms. Along with patience and discipline, diversification can help investors weather challenges, whether geopolitical, economic, or otherwise.
- S&P data © 2026 S&P Dow Jones Indices LLC, a division of S&P Global. All rights reserved. Data as of March 20. Indices are not available for direct investment. Their performance does not reflect the expenses associated with the management of an actual portfolio; Connor Smith, “Stocks Are Rising. S&P 500 Heads Back Toward Record High.” Barron’s, February 12, 2026.
- Returns are based on the Bloomberg US Treasury Bond Index as of March 20. Bloomberg data is provided by Bloomberg Finance LP. Source for US Treasuries: US Department of the Treasury.
- Jack Pitcher and Xavier Martinez, “The $1.6 Trillion Meltdown That Swept Through Software Stocks,” The Wall Street Journal, February 26, 2026.
- James Romoser and Gavin Bade, “Supreme Court Strikes Down Trump’s Global Tariffs,” The Wall Street Journal, February 20, 2026.
- Steve Kopack, “Oil Hits $100 per Barrel for First Time Since July 2022,” NBC News, March 8, 2026.
- MSCI data © MSCI 2026, all rights reserved. Data as of March 20. Indices are not available for direct investment. Their performance does not reflect the expenses associated with the management of an actual portfolio.
- The federal-funds rate is the overnight interest rate at which one depository institution (like a bank) lends to another institution some of its funds that are held at the Federal Reserve. Source: “Federal Reserve Issues FOMC Statement,” Federal Reserve, March 18, 2026.
- Inflation data is as defined by the consumer price index from the US Bureau of Labor Statistics; the core CPI is an aggregate of prices paid by urban consumers for a typical basket of goods, excluding food and energy; Megan Leonhardt, “Core Inflation Holds Steady,” Barron’s, March 11, 2026.
- “Daily Treasury Par Yield Curve Rates,” US Department of the Treasury. Data as of March 20.
- Bloomberg data provided by Bloomberg Finance LP
- The MSCI World Value Index (net div.) gained 0.3%, while the MSCI World Growth Index (net div.) fell 8.3% as of March 20; the Russell 3000 Value Index added 0.9%, while the Russell 3000 Growth Index fell 9.4%; the Russell 2000 Index (net div.) fell 1.5%, while the Russell 1000 Index (net div.) lost 4.7%; the MSCI All Country World Small Cap Index (net div.) advanced 0.4%, while the larger cap MSCI All Country World Index (net div.) lost 3.1%.
- Small and large caps represented by the Russell 2000 Index and Russell 1000 Index, respectively. Small value and small growth represented by the Russell 2000 Value Index and Russell 2000 Growth Index, respectively. Large value and large growth represented by the Russell 1000 Value Index and the Russell 1000 Growth Index, respectively.
- The Fama/French Developed High Profitability Index fell 5.0% versus a decline of 4.6% for its low profitability counterpart as of March 20; the Fama/French Emerging Markets High Profitability Index rose 6.0%, while its low profitability counterpart fell -0.4% as of March 20. See “Index Descriptions” for descriptions of the Fama/French index data.
- The top 10 companies made up 36.4% of the index. Source: “S&P 500 Characteristics,” S&P Global. Data as of February 27.