


Q3 Review: Cautious Investors Tap the Brakes
Dimensional Fund Advisors
After a strong start to the year for US stocks, the engine that has driven them upward for the better part of four years shifted nearer to “idle” in the third quarter. The S&P 500 was able to climb to fresh highs in August, helped by technology stocks, but the gains wouldn’t hold.1 The slowdown came as tensions continued in the Middle East, scrutiny increased about the pace of AI development, and bond yields rose around the world.2 The US Federal Reserve lifted interest rates for the first time in more than three years amid persistently high inflation. In the bond market, US Treasury prices remained lower, and the benchmark 10-year yield spiked above 5%, hitting its highest level since 2002.3 Equity returns in developed international markets were slightly lower than in the US, and emerging markets lagged them for the quarter in an otherwise strong year.
The S&P 500 rose 2.3%, and the tech-heavy Nasdaq added 2.6% as of September 30.4 The tech companies’ highs over the summer came on the heels of continued gains for AI stocks and as SpaceX debuted on public markets in June. But the stock closed the quarter below peaks hit after its IPO, which was the largest ever.5 It’s worth noting that, historically, IPOs have tended to underperform the market in their first year. Late in the quarter, AI stocks pulled back amid, among other things, discussion of the companies taking a more cautious approach to their models’ advances.6
Oil prices surged as US tensions with Iran continued—especially around the Strait of Hormuz, a vital shipping lane for crude.7 However, the US economy, which has become more services oriented, is less dependent on oil than it has been at times in the past. Furthermore, the US is now a net exporter of oil, so the impact of price shocks has become more muted as crude sources have diversified.8
Global equities, as measured by the MSCI All Country World Index (net dividends), rose 1.6% as of September 30. Stocks in developed international markets outside the US added 0.9%, as measured by the MSCI World ex USA Index (net dividends). The MSCI Emerging Markets Index (net dividends) dropped 0.4% but remained well higher for the year, up 23.4%, nearly doubling developed markets’ gains.9
New Global Contenders “Emerge”
The strong year for emerging markets has been led by Taiwan and South Korea, vaulting the countries into the ranks of the world’s 10 largest stock markets. Much of this outperformance has been driven by semiconductor leaders such as TSMC, Samsung, and SK Hynix, which provide chips for AI-related companies.10 These strong returns are a reminder that outperformance can emerge anywhere and that diversified portfolios that include a broad range of companies can allow investors to capture returns where they appear.
Small cap and value stocks, or those with low relative prices, beat large caps and growth stocks in developed markets outside the US and in emerging markets. But in the US, while value topped growth, small caps lagged large caps.11 Elsewhere, high profitability stocks outpaced low profitability stocks in global developed markets, while the opposite was true in emerging markets.12
A Unified Fed Lifts the Level
The US Federal Reserve raised the federal-funds rate to a range between 3.75% and 4% at its most recent meeting in September.13 The vote in favor of a rate hike, which was the first since July 2023, was unanimous, unlike some other recent Fed decisions. Headline inflation remained elevated at 3.4% in August, while core inflation, which excludes more volatile food and energy items, rose 2.4% from a year ago.14
In the bond market, US Treasuries fell 3.0%, sending the yield on the benchmark 10-year Treasury up to 5.29% as of September 30.15 The broader bond market was also lower, with the Bloomberg US Aggregate Bond Index down 3.5% and the Bloomberg Global Aggregate Bond Index (hedged to USD), a broad benchmark of sovereign and corporate debt, falling 2.5% as of September 30.16
With yields at their highest levels in years, investors may ask whether it makes sense to trade some equity exposure for more weight in relatively high-yielding fixed income. But discount rates for stocks factor in current interest rates. All else equal, higher bond yields should lead to higher expected stock returns. In other words, the premium for stocks over bonds may not shrink just because of higher rates.
Exhibit 1
Stocks Shrug?
Average annual equity premium conditional on one-month Treasury bill rates at start of year, 1927–2025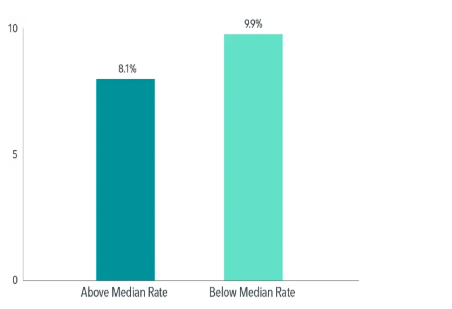
Source: Dimensional Fund Advisors
Past performance is not a guarantee of future results. Actual investment returns may be lower.
Looking at the US equity premium, it has historically been unrelated to the level of interest rates. In years when the one-month US Treasury bill rate was below its historical median, the average equity premium was about 9.9% versus 8.1% in above-median-rate years (see Exhibit 1). However, that difference isn’t statistically reliable.17 Given that the evidence suggests the excess returns for stocks over bills are similar regardless of interest rate level, investors should be cautious changing their stock-bond mix based on current yields.
Reasons for Resolve
The US government debt level this summer topped $40 trillion.18 Investors may find this level of debt concerning and wonder whether a change is needed in their portfolios. Debt concerns have been around for a while and were cited by Moody’s when downgrading the US credit rating last year. Judging by credit default swap (CDS) spreads, which reflect the cost to insure against the US defaulting on its sovereign debt, it doesn’t appear the market’s assessment has gotten any worse. For the past three years, the CDS rate has been around the same level, apart from a brief spike in April 2025.
This is another important reminder for investors that market prices reflect expectations for the future. Those expectations include government debt levels and any perceived implications for stocks and bonds. Investors may be better off sticking with their plan and not changing their asset allocation in response to a notable, if not shocking, milestone.
- S&P data © 2026 S&P Dow Jones Indices LLC, a division of S&P Global. All rights reserved. Data as of September 30; Rob Curran, “US Stocks Rise, S&P 500 Closes at Record High,” The Wall Street Journal, August 13, 2026.
- Tom Westbrook and Amanda Cooper, “Global Bond Yields Hit Fresh Highs, Raising Stakes for Big Borrowers,” Reuters, September 15, 2026.
- Returns are based on the Bloomberg US Treasury Bond Index as of September 30. Bloomberg data is provided by Bloomberg Finance LP. Source for US Treasuries: US Department of the Treasury.
- S&P data and NASDAQ. Data as of September 30.
- Corrie Driebusch, “SpaceX Officially Raises $75 Billion in Record-Breaking IPO,” The Wall Street Journal, June 11, 2026. SpaceX peaked at $225.62 per share on June 16, shortly after its IPO; it finished the quarter at $150.86 per share.
- Karen Gilchrest, “AI Stocks Stumble Amid Growing Safety Fears,” Morningstar, September 14, 2026.
- Farhan Rafid, “Oil Prices Rise as Renewed US-Iran Fighting Deepens Hormuz Supply Risks,” The Wall Street Journal, September 1, 2026.
- “From Net Oil Importer to Net Oil Exporter,” Federal Reserve Bank of St. Louis, April 23, 2026.
- MSCI data © MSCI 2026, all rights reserved. Data as of September 30.
- Yuvraj Malik, “Are Emerging Markets Now an AI Trade? TSMC, Samsung, SK Hynix Drive More than Half the Gains,” Yahoo! Finance, August 24, 2026.
- The MSCI All Country World ex USA Small Cap Index advanced 2.1%, while the larger cap MSCI All Country World-Ex USA Index rose 0.5%; the MSCI All Country World ex USA Value Index gained 3.5%, while the MSCI All Country World ex USA Growth Index fell 2.5%. The Russell 3000 Value Index added 2.3%, while the Russell 3000 Growth Index rose 0.5%; the Russell 2000 Index (small caps) declined 7.2%, while the Russell 1000 Index (large caps) added 1.8%. Frank Russell Company is the source and owner of the trademarks, service marks, and copyrights related to the Russell indices. MSCI data © MSCI 2026, all rights reserved. Data as of September 30.
- The Fama/French Developed High Profitability Index gained 2.3% versus a decrease of 0.6% for its low profitability counterpart as of September 30; the Fama/French Emerging Markets High Profitability Index fell 2.2%, while its low profitability counterpart added 1.7% as of September 30. Past performance is no guarantee of future results. Actual returns may be lower. The Dimensional and Fama/French Indices represent academic concepts that may be used in portfolio construction and are not available for direct investment or for use as a benchmark. Index returns are not representative of actual portfolios and do not reflect costs and fees associated with an actual investment.
- “Federal Reserve Issues FOMC Statement,” Federal Reserve, September 16, 2026.
- Jeff Cox, “Inflation Persisted in August, Potentially Locking in a Fed Interest Rate Hike,” CNBC, September 11, 2026.
- “Daily Treasury Par Yield Curve Rates,” US Department of the Treasury. Data as of September 30.
- Bloomberg data provided by Bloomberg Finance LP.
- The precision around the difference in these averages, measured using what’s known as a t-test, is below the threshold required to distinguish a signal from noise.
- Alan Rappeport, “US Debt Hits $40 Trillion as America’s Borrowing Binge Continues,” The New York Times, August 19, 2026.
This article is intended for educational and informational purposes only and does not constitute specific tax, legal, investment, or financial advice. The information provided is derived from sources believed to be reliable and is based on current tax laws and regulations as of the date of publication, which are subject to change. Aegis Wealth Management, LLC is not a law firm or accounting firm and does not give legal, accounting, or tax advice. Readers should consult with a qualified legal and/or tax professional to understand how these laws and regulations may apply to their unique circumstances. This material is not intended to be relied upon to avoid tax penalties under U.S. federal tax law. Past performance does not guarantee future results. All investing involves risk, including risk of loss.